Understanding Common Specifications for MEMS Silicon Dies
To evaluate the quality and performance of a MEMS silicon die, customers must rely on specifications, at least until they can test parts for themselves. This article will discuss the most common specifications related to these pressure-sensor dies.
The primary thing to understand about MEMS dies is that when they are exposed to either pressure or temperature, they will produce a corresponding output, which will be in millivolts, provided that an input voltage, or excitation voltage, has been supplied. The millivolt output from the MEMS die is essentially the pressure value. Therefore, the general characteristic to look for in any MEMS die is a stable and repeatable output when the die is tested under various conditions.
This article discusses common specifications used to characterize a pressure-sensor die’s performance under different operating conditions.
The first groups of specifications we will discuss are commonly used to characterize how the MEMS die will perform at room temperature (25 °C).
Bridge resistance (or impedance): This indicates the resistance (from Ohm’s Law the voltage divided by the current) measured across the bridge. Due to our Wheatstone bridge design along with our Sentium® and MeritUltra™ processes, the input resistance (+E to -E) and the output resistance (+O to -O) on all of our dies are the same.
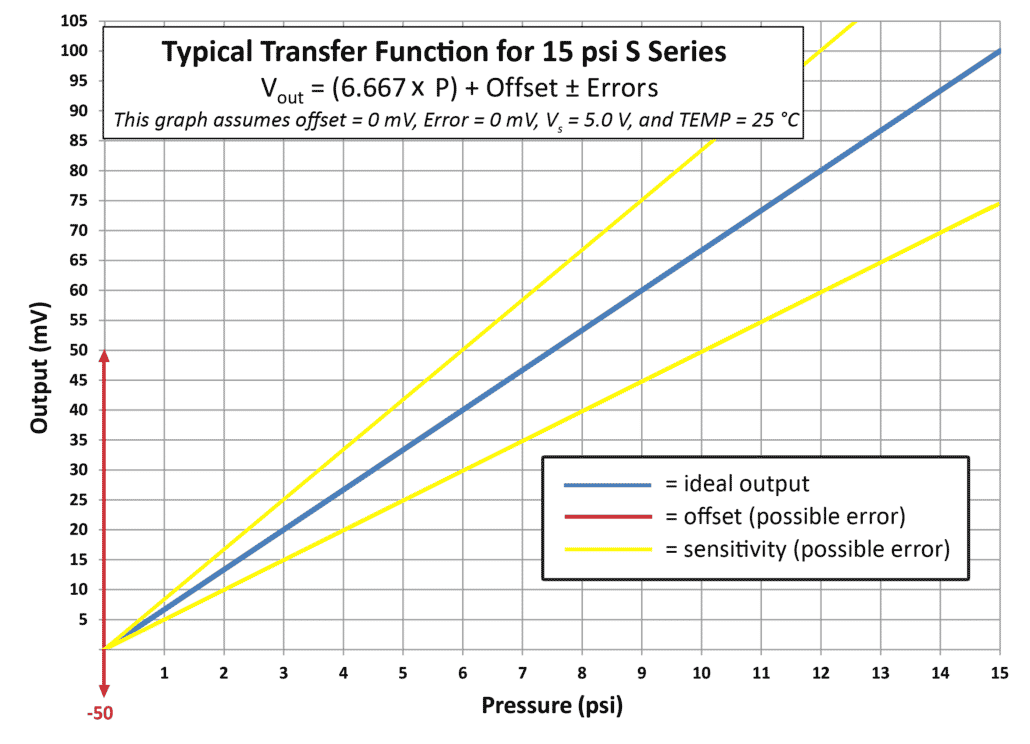
Offset (or zero-pressure output voltage): This indicates the difference, at zero pressure, between zero output and the actual output of the MEMS die. With absolutely no offset, at zero pressure the output would be 0 mV/V. However, with an offset of ±10 mV/V, the difference with 5 volts of excitation could be ±50 mV. Refer to the image of the transfer function below.
Sensitivity (or span): Sensitivity and span are, in general, synonymous. The two terms are used to indicate the electrical output, or the response, of the MEMS die to an applied pressure and supply voltage. It is typically represented by the slope of a line on a graph with output on one axis and pressure (for a given supply voltage) on the other axis. Refer to the image of the transfer function below. Sensitivity is generally stated in terms of microvolts per volt per psi (µV/V/psi).
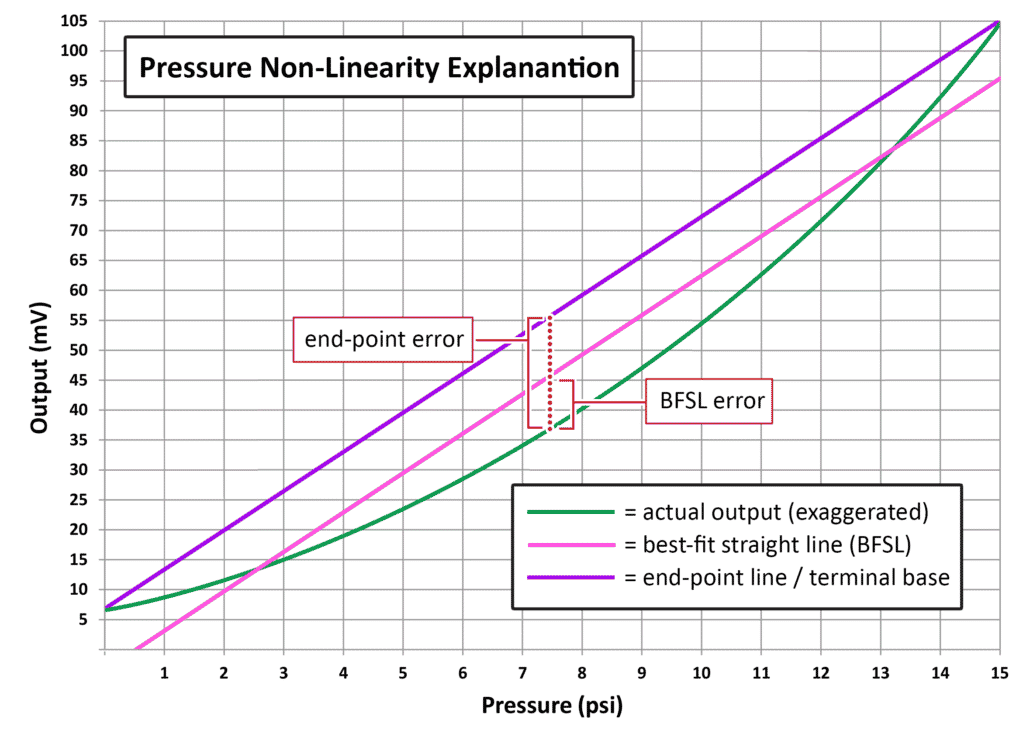
Non-linearity (or linearity): This shows how linear/non-linear the output is. The ideal output is perfectly linear. For example, at a constant 5-volt supply, for every pound per square inch that the pressure were to increase, the output in millivolts would increase linearly, as shown in the image of the transfer function above. The pressure non-linearity is calculated by measuring—at the mid-point of the pressure range—either of two differences: One is between the actual output and the best-fit straight line (BFSL) or the other is between the actual output and the invisible line that connects the two endpoints of the actual output. This line is called the end-point line or terminal base. Refer to the image below. The actual output shown in this image has been exaggerated for illustration. Whether the pressure non-linearity is based on the BFSL or end-point line, it is expressed as a percentage of the full-scale output (FSO).
Pressure hysteresis: This shows the delta, or difference, of the output at zero pressure and then up to full-scale pressure and back to zero pressure. It would be ideal to have no pressure hysteresis, meaning the output would be the exact same every time the pressure returned to zero. This specification will give you one indication of the die’s repeatability. Pressure hysteresis is expressed as a percentage of full-scale output (FSO).
The next three specifications indicate how a part will behave over a specified temperature range. At Merit Sensor all MEMS dies are tested over a temperature range from -40 to 150 °C. These three specifications are first-order effects.
Temperature coefficient of offset (TCO): This is also known as temperature coefficient at zero pressure (TCZ). This indicates the offset changes at zero pressure as temperature changes.
Temperature coefficient of resistance (TCR): This indicates how the resistance changes at zero pressure as temperature changes. The bridge resistance does change significantly over temperature.
Temperature coefficient of sensitivity (TCS): This is also known as temperature coefficient of span. It indicates the deviation in full-scale output as temperature changes. As the temperature increases, sensitivity decreases. So at room temperature you might get a 100 mV output, but at 150 °C the output will decrease to around 75 mV.
The great news is that all the errors listed above are repeatable and consistent, which means they respond well to compensation. In addition to manufacturing MEMS dies, Merit Sensor also builds pressure-sensor packages and performs calibration over various temperature ranges.
The following two specifications, however, deal with errors that cannot be compensated: thermal hysteresis and long-term drift. Therefore, if you are trying to decide which MEMS die to buy, you will want to find a supplier that produces parts with good specs in these two areas. We, at Merit Sensor, know that our customers do not want their parts, which contain our MEMS dies, to fail in their customers’ applications; therefore, we take pride in producing MEMS dies with excellent thermal hysteresis values and long-term stability.
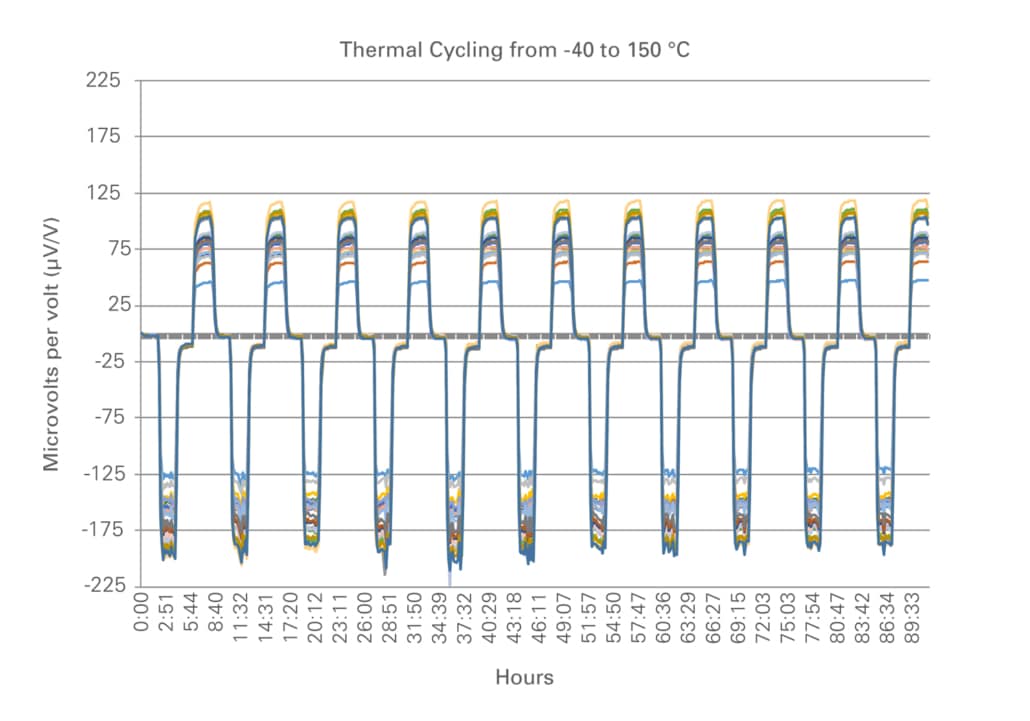
Thermal hysteresis: This is typically performed at zero pressure and shows the difference between the output when the temperature is at room temperature and then increased to 150 °C and then returned to room temperature and then decreased to -40 °C and then returned again to room temperature and so on. This testing characterizes the repeatability of the die over numerous thermal cycles. It would be ideal to get the same output every time the temperature returned to a given value.
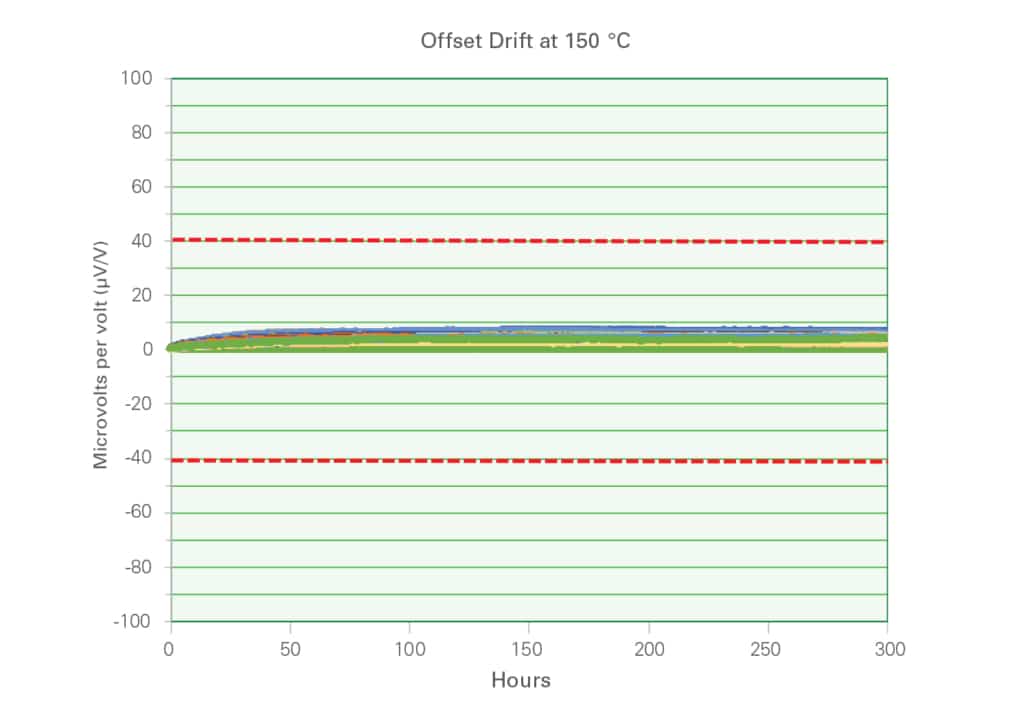
Long-term stability (or long-term drift): This specification indicates how stable the output of the die will remain, or, in other words, how little the offset will drift, over time and sustained temperature. We have tested parts, for example, at 150 °C for 300 hours.
One thing to watch for is a data sheet advertising a MEMS die with an accuracy of ±0.25 %. Here’s the catch: That accuracy refers only to non-linearity at room temperature; it does not take the other errors that have been discussed into consideration. Hopefully this article has helped you to better understand the different performance characteristics of MEMS silicon dies and the specifications that are used to quantify the dies’ performance.
Finally, if you would like to learn more about the technology and performance of MEMS dies, we invite you to watch our recently broadcast webinar, which is now on demand.